The First Ruler of Distinguishability
Why Fisher information is the local geometry of statistical models
1 The Question
Suppose we have two probability distributions, \(p\) and \(q\), defined over the same space. How far apart are they?
This is not a rhetorical question. Different answers lead to different algorithms, different criteria for what it means to learn well, and fundamentally different pictures of what the probability space looks like. The choice of distance is a geometric choice. And geometry, as we will see, has consequences that reach all the way into how neural networks are trained.
The naïve answer (subtract the distributions and take a norm) immediately runs into trouble. The \(L^2\) norm,
\[ \|p-q\|_{L^2} = \sqrt{ \int \left( p(x)-q(x) \right)^2\,dx} \tag{1}\]
is indifferent to where the points of the sample space \(X\) sit relative to each other. Consider a narrow Gaussian concentrated near pixel \(i\) of an image. Shifting it one pixel to the right produces a distribution that is nearly identical to the original in any intuitive sense. But when the distributions are narrow and have little overlap, the \(L^2\) norm can treat a small spatial shift almost as harshly as a much larger shift, because it sees pointwise mismatch rather than displacement cost.
This example is deliberately extreme. For broader distributions, \(L^2\) certainly responds to overlap. The deeper problem is not that \(L^2\) is always insensitive, but that it is not transport-aware: it penalizes pointwise differences regardless of whether probability mass moved a little or a lot. The norm sees only differences in probability mass at each location; it has no vocabulary for the cost of moving that mass through space. For most problems of interest, this is exactly the missing structure.
A better answer requires first deciding what structure the distance should respect: there are two natural answers and they come from completely different directions. In this post, we discuss the first one.
2 Distinguishability as Geometry
The first answer starts from a statistical question: how well can you tell two distributions apart from data?
If \(p\) and \(q\) are very close, distinguishing them requires many samples; if they differ substantially, even a small sample may suffice. This notion of statistical distinguishability is the basis of Fisher’s approach [1].
The key object is the score function, which is the gradient of the log-likelihood with respect to the parameter. For a parameter family \(p(x;\theta)\), the score at \(\theta\) is:
\[ s(x;\theta) = \frac{\partial}{\partial \theta} \log p(x;\theta). \tag{2}\]
The score measures, infinitesimally, how the log-density changes as you move in parameter space. It is the logarithmic velocity of the distribution in the direction of \(\theta\).
To quantify how large this velocity is—how much the distribution changes per unit movement in \(\theta\)—Fisher took the expected squared magnitude of the score. In 1-D, this gives the Fisher information [1, 2]:
\[ \mathcal I(\theta) = \mathbb E_\theta \left[ \left( \frac{\partial}{\partial \theta} \log p(x;\theta) \right)^2 \right]. \tag{3}\]
In higher dimensions, this becomes the Fisher Information Matrix (FIM):
\[ F_{ij}(\theta) = \mathbb E_\theta \left[ \partial_i \log p(x;\theta) \, \partial_j \log p(x;\theta) \right]. \tag{4}\]
Here \(\mathbb E_\theta[\cdot]\) means expectation with respect to \(x\sim p(\cdot\,;\theta)\). The symbol \(\partial_i\) means differentiation with respect to the \(i\)th parameter coordinate, \(\partial/\partial\theta^i\). Later, when expressions such as \(F_{ij}(\theta)\delta^i\delta^j\) appear without an explicit summation sign, they use the standard repeated-index convention:
\[ F_{ij}(\theta)\delta^i\delta^j = \sum_{i,j}F_{ij}(\theta)\delta^i\delta^j. \]
Finally, \(T_\theta\mathcal M\) denotes the tangent space to the parameter manifold at \(\theta\): the vector space of infinitesimal parameter directions.
This matrix is not merely a useful statistic. For a regular, locally identifiable model, it is a Riemannian metric tensor on the parameter manifold \(\mathcal{M}\): a smoothly varying inner product on each tangent space \(T_{\theta}\mathcal{M}\), encoding the infinitesimal statistical distinguishability of nearby distributions. If the parameterization is redundant, the matrix may instead be singular and define only a positive semidefinite form. The systematic study of this structure is the subject of information geometry [3, 4].
3 The FIM as a Pullback Metric
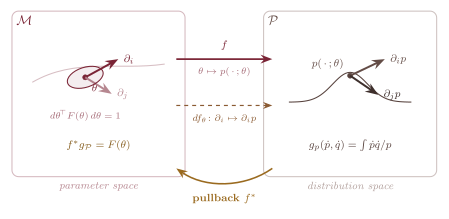
The FIM has a clean geometric origin and is not an ad hoc construction. It is the metric that parameter space inherits from the space of distributions via the parametric family. This is the concept of pullback metric.
Pullback metrics. Given a smooth map \(f:M \to N\) between manifolds and a Riemannian metric \(g\) on \(N\), the pullback metric \(f^{*}g\) on \(M\) is defined by:
\[ \left(f^{*}g \right)(u,v) = g_{f(p)}\left(df_p(u),df_p(v)\right) \tag{5}\]
where \(df_p: T_p M \to T_{f(p)} N\) is the differential of \(f\) at \(p\), and \(u,v \in T_pM\) are tangent vectors. Intuitively, to measure vectors in \(M\), push them forward to \(N\) using \(df\) and measure them using \(g\). For \(f^{*}g\) to be a genuine metric (positive definite), \(f\) must be an immersion, i.e., its differential must be injective at each point.
The FIM as a pullback. Let \(\mathcal{P}\) be the space of strictly positive probability densities. A tangent vector at \(p\) can be represented by a density perturbation \(\dot p\) satisfying \(\int \dot p(x)\,dx=0\). The Fisher–Rao inner product on two such perturbations is
\[ g_p(\dot p,\dot q) = \int \frac{\dot p(x)\dot q(x)}{p(x)}\,dx. \tag{6}\]
Equivalently, after writing the perturbations in logarithmic form as \(u=\dot p/p\) and \(v=\dot q/p\), this becomes the \(L^2(p)\) inner product on score-like functions:
\[ g_p(\dot p,\dot q) = \mathbb E_p[u v]. \tag{7}\]
In the general pullback notation above, the parameter manifold \(\mathcal M\) plays the role of \(M\), and the probability space \(\mathcal P\) plays the role of \(N\). The parametric family defines the model map
\[ f:\mathcal{M} \to \mathcal{P}, \quad \theta \mapsto p(\cdot\,;\theta). \tag{8}\]
Its differential sends a parameter direction to a density perturbation:
\[ df_\theta(\partial_i) = \partial_i p(\cdot\,;\theta). \tag{9}\]
Dividing this perturbation by \(p\) gives its logarithmic representation,
\[ \frac{df_\theta(\partial_i)}{p(\cdot\,;\theta)} = \frac{\partial_i p(\cdot\,;\theta)}{p(\cdot\,;\theta)} = \partial_i\log p(\cdot\,;\theta), \tag{10}\]
which is precisely the score component. This is the bridge between parameter geometry and distribution geometry. Pulling back the Fisher–Rao inner product gives
\[ \left(f^{*}g\right)_{ij} = = \int \frac{\partial_i p\,\partial_j p}{p}\,dx = \mathbb{E}_{\theta}\left[\partial_i \log p \cdot \partial_j \log p \right] = F_{ij}(\theta) \tag{11}\]
The FIM is the metric that \(\mathcal{M}\) inherits from \(\mathcal{P}\). Geometry flows downward from the space of distributions to the parameter space.
Coordinate invariance. The entries of the Fisher Information Matrix depend on the coordinates used to describe the parameter space. But the underlying geometric object does not.
Mathematically, the FIM is a \((0,2)\)-tensor: at each point \(\theta\), it takes two tangent vectors \(u,v \in T_\theta\mathcal M\) and returns a scalar,
\[ F_\theta(u,v) = \sum_{i,j} F_{ij}(\theta)u^i v^j. \tag{12}\]
In other words, the Fisher matrix is the coordinate representation of an intrinsic inner product on parameter directions. The matrix entries may change when we change coordinates, but the scalar quantity \(F_\theta(u,v)\) does not.
Under a reparameterization \(\tilde{\theta}=\phi(\theta)\), the FIM transforms as a \((0,2)\)-tensor:
\[ \tilde F_{kl} = \sum_{i,j} F_{ij} \frac{\partial \theta^i}{\partial \tilde\theta^k} \frac{\partial \theta^j}{\partial \tilde\theta^l}. \tag{13}\]
This is exactly the transformation law for a Riemannian metric. The FIM captures intrinsic geometry, not a coordinate artifact. Changing how we label the parameters changes the matrix entries, but not the statistical distance measured by the metric.
4 Chentsov’s Theorem: The Unique Invariant Metric
The pullback construction shows that FIM is natural. A deeper result, Chentsov’s theorem [5], shows it is unique.
Chentsov’s Theorem.
Informal Version. The Fisher-Rao metric is the unique Riemannian metric on the statistical manifold, up to a positive scalar multiple, that is invariant under statistically sufficient transformations of the observations.
Equivalently: if a transformation of the data preserves all information relevant to \(\theta\), then it should preserve the geometry of the model. Fisher-Rao is the only Riemannian metric with this property.
A more formal version (finite-dimensional). Let
\[ \Delta_n = \left\{ p=(p_1,\ldots,p_n): p_i>0,\ \sum_{i=1}^n p_i=1 \right\} \tag{14}\]
be the interior of the probability simplex. This is the finite/discrete setting: points of \(\Delta_n\) are categorical probability distributions over \(n\) outcomes. Suppose that for each \(n\), we assign a Riemannian metric \(g^{(n)}\) on \(\Delta_n\). The assignment is called monotone under Markov maps if, for every stochastic map \(T:\Delta_n\to\Delta_m\) (equivalently, a Markov transition matrix),
\[ g^{(m)}_{Tp}(T_*u,T_*u) \leq g^{(n)}_p(u,u), \tag{15}\]
for every tangent vector \(u\in T_p\Delta_n\). In words: applying a noisy data-processing map cannot increase statistical distinguishability.
Here \(T_*u\) denotes the pushforward of the tangent vector \(u\) by the map \(T\): it is the infinitesimal direction obtained after applying the data-processing map.
Chentsov’s theorem says that, up to an overall positive constant, the only such monotone Riemannian metric is the Fisher-Rao metric:
\[ g_p(u,v) = c\sum_{i=1}^n \frac{u_i v_i}{p_i}, \qquad c>0. \tag{16}\]
Equivalently, in a parametric model \(p(x;\theta)\), this metric pulls back to the Fisher information matrix
\[ F_{ij}(\theta) = \mathbb E_\theta \left[ \partial_i\log p(x;\theta)\, \partial_j\log p(x;\theta) \right]. \tag{17}\]
Thus Fisher geometry is not merely invariant under reparameterizing \(\theta\); it is also the unique geometry that contracts under statistically noisy transformations of the observations.
Chentsov is not saying the FIM is a natural choice among many. He is saying it is the only choice consistent with the principle that geometry should not depend on how data is represented. If two experimenters measure the same phenomenon but record their observations differently—and neither loses information—their geometric picture of the statistical model must agree. The FIM is the unique metric with this property.
This is a strong and somewhat surprising result. It says the geometry of statistical inference is not a convention or a convenience: it is forced by the structure of the problem.
This uniqueness result is local. The Fisher metric is an infinitesimal object: it is a tensor at each point of parameter space, giving an inner product on tangent vectors. It measures how fast nearby distributions diverge statistically, but it says nothing directly about distributions that are far apart.
The local tensor nevertheless induces a global Fisher–Rao distance: measure the Fisher length of every curve joining two model distributions and take the infimum. Curve length depends on the chosen path; the geodesic distance selects a shortest one when such a minimizer exists. Finding these geodesics is generally difficult, and closed-form distances are available only for a limited collection of statistical families [6].
Wasserstein geometry also has both global and infinitesimal formulations, so the essential contrast is not simply local versus global. It is what each geometry considers meaningful: Fisher measures statistical distinguishability without requiring a metric on the sample space, whereas Wasserstein measures the displacement of mass using precisely such a ground metric. That is the first major contrast between the two rulers.
5 The Cramér-Rao Bound: Geometry in Action
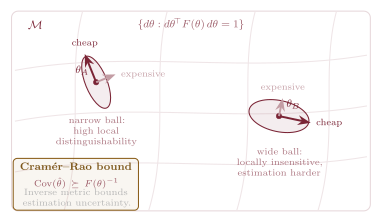
The Fisher metric does more than organize the geometry of a statistical model. Under the regularity and unbiasedness assumptions of classical estimation theory, it places a hard lower bound on estimation uncertainty. Directions with little Fisher information are intrinsically difficult to estimate from data. The Cramér–Rao bound makes this precise [1, 2].
For an unbiased estimator \(\hat{\theta}\) of a scalar parameter \(\theta\), the bound states:
\[ \operatorname{Var}_{\theta}(\hat{\theta}) \geq \frac{1}{\mathcal{I}(\theta)} \tag{18}\]
Here \(\operatorname{Var}_\theta\) denotes variance under \(p(\cdot\,;\theta)\).
In vector form, for an unbiased estimator \(\hat{\theta}\) of \(\theta \in \mathbb{R}^n\) and a nonsingular FIM:
\[ \operatorname{Cov}_{\theta}(\hat{\theta}) \succeq F(\theta)^{-1} \tag{19}\]
where \(\operatorname{Cov}_\theta\) denotes covariance under \(p(\cdot\,;\theta)\), and \(\succeq\) denotes the Loewner partial order on positive semidefinite matrices: \(A\succeq B\) means \(A-B\) is positive semidefinite. No unbiased estimator can have covariance smaller than \(F(\theta)^{-1}\).
For deep learning, this statement should not be read too literally. We are usually not searching for an unbiased estimator of a true parameter vector; neural networks are overparameterized, non-identifiable, and trained for predictive performance rather than classical parameter recovery. The relevance is geometric: when the Fisher is nonsingular, its inverse converts an ordinary gradient covector into a geometry-aware parameter direction. In singular models, practical methods instead use damping, approximations, or a generalized inverse [7].
The geometric reading is direct: \(F(\theta)^{-1}\) is the dual metric on the cotangent space, and the bound says that estimation uncertainty is bounded below by the inverse of the local metric scale of the statistical manifold. Where the Fisher metric is large in a direction—where distributions are highly distinguishable and change rapidly along that direction—estimation is easy. Conversely, where the local distinguishability is small, estimation is hard.
Proof sketch. Fix an unbiased estimator \(\hat{\theta}\) of a scalar parameter \(\theta \in \mathbb{R}\). Unbiasedness means
\[ \mathbb{E}_{\theta}[\hat{\theta}(x)] = \int \hat{\theta}(x)p(x;\theta)\,dx = \theta. \tag{20}\]
Differentiate both sides with respect to \(\theta\):
\[ \frac{\partial}{\partial \theta} \int \hat{\theta}(x)p(x;\theta)\,dx = 1. \tag{21}\]
Exchanging derivative and integral gives
\[ \int \hat{\theta}(x) \frac{\partial}{\partial \theta}p(x;\theta)\,dx = 1. \tag{22}\]
Now use the score identity
\[ \frac{\partial}{\partial \theta}p(x;\theta) = p(x;\theta)\, \frac{\partial}{\partial \theta}\log p(x;\theta) = p(x;\theta)s(x;\theta). \tag{23}\]
Substituting this into the previous equation gives
\[ \mathbb{E}_{\theta}[\hat{\theta}(x)s(x;\theta)]=1 \tag{24}\]
where \(s=\partial_{\theta}\log p\) is the score. We also use Fisher’s identity:
\[ \mathbb{E}_{\theta}[s(x;\theta)] = \int \frac{\partial}{\partial \theta}p(x;\theta)\,dx = \frac{\partial}{\partial \theta}\int p(x;\theta)\,dx = 0. \tag{25}\]
Because the score has mean zero, the covariance between \(\hat{\theta}\) and \(s\) is
\[ \operatorname{Cov}_{\theta}(\hat{\theta},s) = \mathbb{E}_{\theta}[\hat{\theta}s] - \mathbb{E}_{\theta}[\hat{\theta}]\mathbb{E}_{\theta}[s] = 1. \tag{26}\]
Now apply the Cauchy-Schwarz inequality to this covariance:
\[ \operatorname{Cov}_{\theta}(\hat{\theta},s)^2 \leq \operatorname{Var}_{\theta}(\hat{\theta})\cdot\operatorname{Var}_{\theta}(s) \tag{27}\]
The left side is \(1\), and the variance of the score is the Fisher information:
\[ \operatorname{Var}_{\theta}(s) = \mathbb{E}_{\theta}[s^2] = \mathcal{I}(\theta). \tag{28}\]
Therefore,
\[ 1 \leq \operatorname{Var}_{\theta}(\hat{\theta})\mathcal{I}(\theta), \tag{29}\]
which is equivalent to
\[ \operatorname{Var}_{\theta}(\hat{\theta}) \geq \frac{1}{\mathcal{I}(\theta)}. \tag{30}\]
The multivariate case follows the same logic, but covariance replaces variance and the score becomes a vector. Let
\[ s(x;\theta) = \nabla_\theta \log p(x;\theta). \tag{31}\]
For an unbiased vector estimator, differentiating \(\mathbb{E}_\theta[\hat{\theta}]=\theta\) gives
\[ \mathbb{E}_\theta[(\hat{\theta}-\theta)s^\top]=I. \tag{32}\]
This is the vector analogue of the scalar covariance identity above. Applying the matrix Cauchy-Schwarz inequality yields
\[ \operatorname{Cov}_{\theta}(\hat{\theta}) \succeq F(\theta)^{-1}. \tag{33}\]
One way to read this step is through a Schur-complement argument: the joint covariance block matrix of the estimator error and the score is positive semidefinite, and using \(\mathbb{E}_\theta[(\hat{\theta}-\theta)s^\top]=I\) forces the estimator covariance block to dominate the inverse Fisher block. This is exactly the matrix version of the scalar inequality above.
The Cramér-Rao bound is one of the oldest results in mathematical statistics but its geometric interpretation—as a statement about the inverse of a Riemannian metric—was not fully articulated until Rao’s formulation [2] and the subsequent development of information geometry [3].
6 What the Fisher Metric Cannot See
For a parametric model, the Fisher metric measures how the model distribution changes as \(\theta\) varies. It is sensitive to the statistical shape of the family—how its distributions differ from each other—but it does not require a distance between points of the sample space \(X\).
If you relabel the points of \(X\) through an invertible measurable transformation, the Fisher metric does not change. This invariance is related to the principle behind Chentsov’s theorem, and it is both a strength and a limitation.
It is a strength because the geometry is intrinsic to the statistical model rather than an artifact of how observations are labeled. It is a limitation because Fisher supplies no ground metric telling us which sample points are spatially close. To visualize the distinction, imagine a density plot: the horizontal axis is the sample space, while the vertical axis records how much probability mass sits at each location. Fisher can detect that the heights have changed, and a particular parametric family may make nearby shifts statistically similar. But Fisher geometry alone does not know that neighboring pixels are close, so it gives no intrinsic guarantee that an image shifted two pixels is closer than a spatially unrelated change. In this visual metaphor, it measures how probability weights change vertically without encoding distance along the horizontal axis.
Learning objectives based on Kullback–Leibler (KL) divergence inherit Fisher geometry in their local second-order behavior [3, 8]. Population maximum likelihood can be expressed through KL minimization, and variational objectives use KL terms explicitly. This is not merely an analogy; the next section previews the precise local connection. The key point is that KL-based objectives compare probability assignments without requiring a ground metric on the data space.
A related failure appears for \(f\)-divergences such as Jensen–Shannon in early GANs: when supports are disjoint or nearly disjoint, the divergence can saturate and provide weak gradients, motivating Wasserstein-based objectives [9]. Wasserstein objectives address the missing structure by comparing distributions through the cost of moving mass across the sample space.
When \(F(\theta)\) is nonsingular, natural gradient descent [10] corrects the optimization geometry by using \(F(\theta)^{-1}\) to rescale the gradient, moving in the steepest direction with respect to the Fisher metric rather than the Euclidean one. This is the geometry-aware update in parameter space—but it still does not introduce a ground metric on the observations, which we will come back to in a future post.
7 Preview: Fisher as Local KL Geometry
The Fisher metric does not stand alone. It is the local, symmetric residue of a richer asymmetric object: the KL divergence. This connection—which we will come back to in another blog post—is worth previewing here because it explains why the Fisher metric appears so naturally in learning.
Fisher metric as the Hessian of KL. Fix a parametric family \(p(\cdot\,;\theta)\) and define a local KL function by holding the second argument fixed:
\[ D_{\theta}(\delta) = \mathrm{KL} \left( p(\cdot\,;\theta+\delta) \,\Big\|\, p(\cdot\,;\theta) \right). \tag{34}\]
At \(\delta=0\), the two distributions agree, so
\[ D_{\theta}(0)=0. \tag{35}\]
The first derivative also vanishes. Intuitively, KL is minimized when the two distributions are the same, so there is no first-order change at \(\delta=0\):
\[ \left. \frac{\partial D_{\theta}(\delta)} {\partial \delta^i} \right|_{\delta=0} = 0. \tag{36}\]
The second derivative is the Fisher information matrix:
\[ \left. \frac{\partial^2 D_{\theta}(\delta)} {\partial \delta^i \partial \delta^j} \right|_{\delta=0} = F_{ij}(\theta). \tag{37}\]
Therefore, the Taylor expansion begins at second order:
\[ \mathrm{KL} \left( p(\cdot\,;\theta + \delta) \,\Big\|\, p(\cdot\,;\theta) \right) = \frac{1}{2}\,F_{ij}(\theta)\delta^i \delta^j + \mathcal{O}(\|\delta\|^3). \tag{38}\]
The same second-order term appears if the KL direction is reversed:
\[ \mathrm{KL} \left( p(\cdot\,;\theta) \,\Big\|\, p(\cdot\,;\theta + \delta) \right) = \frac{1}{2}\,F_{ij}(\theta)\delta^i \delta^j + \mathcal{O}(\|\delta\|^3). \tag{39}\]
This is why Fisher geometry is the local symmetric part of KL. The asymmetry of KL is real, but it does not show up in the quadratic approximation; it appears only at third order and beyond.
Here \(\mathcal{O}(\|\delta\|^3)\) means that the omitted terms are of cubic order or higher in the displacement size \(\|\delta\|\).
This means two things. First, any algorithm that minimizes KL divergence inherits Fisher geometry in its local second-order behavior. Minimizing KL gives Fisher as the local geometry, but the actual update rule may still use Euclidean gradients—this is precisely the gap that natural gradient descent, which will be discussed in future posts, is designed to close. Second, the Fisher metric inherits its symmetry from the Hessian operation: even though KL itself is asymmetric (because \(\mathrm{KL}(p\|q) \neq \mathrm{KL}(q\|p)\) in general), its second-order term is a symmetric bilinear form—the metric tensor \(F_{ij}\).
The asymmetry of KL beyond second order encodes something important: depending on which argument contains the optimized model, the two directions of KL can encourage qualitatively different mode-covering and mode-seeking behavior. I will examine this asymmetry in detail and show how it points toward Schrödinger bridges.
Many learning objectives compare distributions through KL divergence or likelihood. Locally, these objectives inherit the Fisher metric: directions in parameter space are not equally meaningful, because some directions change the model distribution much more than others.
Ordinary gradient descent ignores this geometry. It treats parameter space as Euclidean, so a step of the same coordinate size is treated as equally important in every direction. When \(F\) is invertible, natural gradient descent corrects this by using \(F(\theta)^{-1}\nabla L\), the steepest descent direction measured in distribution space rather than raw coordinates. Singular models require a damped inverse or generalized inverse instead [7].
For modern neural networks, however, the full FIM is impossible to form explicitly: with \(N\) parameters, it is an \(N\times N\) matrix. Practical methods therefore use approximations such as empirical Fisher estimates, matrix-free Fisher-vector products, diagonal approximations, low-rank approximations, or structured approximations such as K-FAC [7, 11]. These approximations are an active research area: they change the computation, but not the underlying geometric object.
This is the first practical lesson of Fisher geometry: learning is not just about the slope of the loss, but about the geometry of how parameters change distributions.
8 The Fisher Metric in the Exponential Family
The previous section showed that KL locally contains Fisher geometry in its second-order term. Exponential families are the cleanest setting where this local picture becomes algebraic: the Fisher metric, KL divergence, and convex duality can all be written in terms of a single function, the log-partition function.
The Fisher metric takes a particularly clean form for exponential families, which include Gaussians, Bernoulli, Poisson and several other distributions used in practice.
An exponential family has density
\[ p(x;\theta) = h(x)\exp\,\{\theta^{\top}\,T(x)-A(\theta)\} \tag{40}\]
where \(T(x)\) are the sufficient statistics, \(\theta\) are the natural parameters, and \(A(\theta)\) is the log-partition function. A direct calculation shows that the FIM is the Hessian of \(A\):
\[ F_{ij} = \frac{\partial^2\,A}{\partial\theta^i\,\partial\theta^j}. \tag{41}\]
Derivation. For the exponential family, the log-density is
\[ \log p(x;\theta) = \theta^{\top}T(x)-A(\theta)+\log h(x). \tag{42}\]
Differentiating with respect to the natural parameter \(\theta^i\) gives the score component
\[ \partial_i \log p(x;\theta) = T_i(x)-\partial_i A(\theta). \tag{43}\]
The score has mean zero by Fisher’s identity:
\[ \mathbb{E}_{\theta}\left[\partial_i \log p(x;\theta)\right] = 0. \tag{44}\]
Therefore,
\[ F_{ij} = \mathbb{E}_{\theta} \left[ \left(T_i-\partial_i A(\theta)\right) \left(T_j-\partial_j A(\theta)\right) \right] = \operatorname{Cov}_{\theta}(T_i,T_j) = \partial_i\partial_j A(\theta) \tag{45}\]
The FIM is the covariance of the sufficient statistics, or equivalently, the Hessian of the log-partition function with respect to the natural parameters \(\theta\). Since \(A\) is convex, \(F\) is positive semidefinite. For a minimal regular exponential family, this covariance is positive definite and therefore defines a genuine Riemannian metric; a redundant representation can leave it singular [8].
Example: Gaussians. The Gaussian \(\mathcal{N}(\mu,\sigma^2)\) belongs to an exponential family with natural parameters
\[ \theta_1=\frac{\mu}{\sigma^2}, \qquad \theta_2=-\frac{1}{2\sigma^2}. \tag{46}\]
In those coordinates,
\[ F_{\theta} = \nabla^2 A(\theta). \tag{47}\]
To express the same metric in the more familiar coordinates \((\mu,\sigma^2)\), use the tensor transformation rule. If \(\alpha=(\mu,\sigma^2)\) denotes the new coordinates, then
\[ F^{(\alpha)}_{ab} = \sum_{i,j} F^{(\theta)}_{ij} \frac{\partial \theta^i}{\partial \alpha^a} \frac{\partial \theta^j}{\partial \alpha^b}. \tag{48}\]
Applying this transformation gives
\[ F(\mu,\sigma^2) = \begin{pmatrix} 1/\sigma^2 & 0 \\ 0 & 1/(2\sigma^4) \end{pmatrix} \tag{49}\]
This is the correct Fisher metric in \((\mu,\sigma^2)\) coordinates, but it is not obtained as the Hessian of \(A\) with respect to \((\mu,\sigma^2)\) directly—those are not natural parameters. For this two-parameter manifold of univariate Gaussians, the Fisher–Rao distance has a closed-form expression through its hyperbolic geometry [4, 6]. Closed forms do not extend automatically to arbitrary exponential families.
Signpost: dual coordinates. The fact that the Fisher metric on an exponential family is the Hessian of a convex function is deeply connected to the duality structure of information geometry [3]. The convex function \(A\) generates the natural-parameter coordinates \(\theta\). Its gradient generates the expectation-parameter coordinates
\[ \eta = \nabla A(\theta). \tag{50}\]
The Legendre transform of \(A\) then exchanges these two coordinate systems:
\[ A^{*}(\eta) = \sup_{\theta} \left\{ \theta^{\top}\eta - A(\theta) \right\}. \tag{51}\]
In the same exponential-family setting, KL divergence between two members of the family is the Bregman divergence generated by \(A\), with a noteworthy reversal of arguments:
\[ \mathrm{KL}\!\left(p_{\theta}\,\|\,p_{\theta'}\right) = D_A(\theta',\theta) = A(\theta') -A(\theta) -\nabla A(\theta)^{\top}(\theta'-\theta). \tag{52}\]
This is only a signpost for now. The important point for this post is that Fisher geometry is not isolated: it sits inside a larger convex-dual structure that will return when we discuss KL divergence, natural gradients, and learning dynamics.
9 The First Ruler
Chentsov’s theorem gives Fisher geometry its special status. Subject to its assumptions, Fisher–Rao is not just a convenient measure of local distinguishability: up to scale, it is the unique Riemannian metric compatible with statistically sufficient transformations.
That is the lesson of the first ruler. Fisher information does not merely assign numbers to estimators or appear in asymptotic statistics. It describes the local geometry a regular statistical model carries: directions are long or short according to how distinguishable the corresponding changes in distribution are.
But the same invariance also marks its limitation. Fisher geometry does not supply a ground metric on the sample space. It knows how probability assignments change statistically; by itself, it does not know how far mass has moved spatially.
This is where the second ruler enters. The next post turns to Wasserstein geometry, where comparison is governed by displacement. Under appropriate regularity assumptions and quadratic transport cost, Brenier’s theorem [12] identifies the unique optimal transport map as the gradient of a convex potential.
10 What Comes Next
This post introduced the first ruler: Fisher information, the geometry of statistical distinguishability. The next post introduces the second ruler: Wasserstein distance, the geometry of displacement.
Together, these two rulers set up the main tension of the series. Fisher asks how distributions differ statistically; Wasserstein asks how probability mass moves spatially. Learning needs both perspectives.
From there, the story becomes more interesting. KL divergence will appear as the asymmetric object underlying Fisher geometry. Schrödinger bridges will connect entropy and transport into a single stochastic path. Hodge decomposition will reveal the algebraic anatomy of optimal flows. Natural gradient will show what it means for optimization to respect statistical geometry. Langevin dynamics will then add calibrated noise, turning gradient descent from a mode-seeking optimizer into a sampler over distributions.
Finally, these ideas will reappear in modern machine learning, where diffusion models, flow matching, natural gradients, Langevin samplers, and Bayesian methods can all be understood as approximations to pieces of this geometry.
The goal of this series is not to argue that these subjects are secretly the same theory. They are not. Rather, the claim is that they discovered compatible pieces of the same geometric picture: information provides the statistical ruler, transport provides the spatial ruler, KL provides direction, entropy provides stochastic paths, Langevin connects optimization to sampling, and topology explains the obstructions.
༺ The End ༻